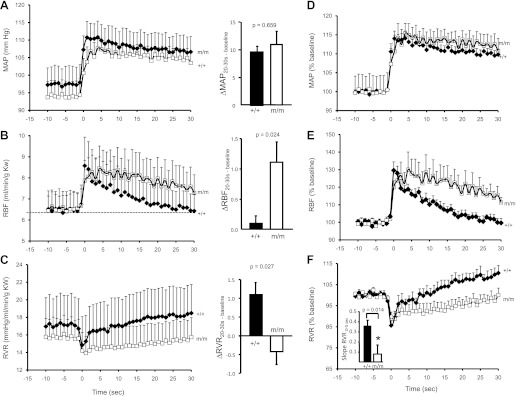
Fig. 3.
Myogenic regulation of renal blood flow (RBF) and renal vascular resistance (RVR) is altered in βENaC m/m mice. Time course of the regulatory response of mean arterial pressure (MAP; A and D), RBF (B and E), and RVR (C and F) in wild-type (+/+, filled symbols, n = 6) and mutant (m/m, open symbols, n = 7) mice 10 s before and 30 s after the step increase in pressure. Data are presented as absolute values in A–C and normalized changes to minimize variance in D–F. The change in MAP, RBF, and RVR from 20 to 30 s to baseline is shown on right in A–C. Baseline values of MAP (mmHg), RBF (ml·min−1·g kidney wt−1), and RVR were not different between +/+ and m/m mice (see Table 1). Following a similar increase in MAP, the transient increase in RBF and decrease in RVR are similar between +/+ and m/m mice. Immediately following the transient drop, RVR begins to increase in the +/+, but remains low in the m/m. The inset in F shows the rate of increase in RVR during the first 5 s following the drop in RVR is significantly greater in +/+ vs. m/m mice (P = 0.014). By 20–30 s following the step increase in MAP, RBF in the +/+ is completely corrected while RBF remains elevated in m/m animals (P = 0.024, B, right). By 20–30 s following the step increase in MAP, the change in RVR from baseline is significantly greater in the +/+ vs. m/m (P = 0.027, C, right). Data are means ± SE. *Significantly different from βENaC +/+ group at the P value indicated.

