
Fig. 4.
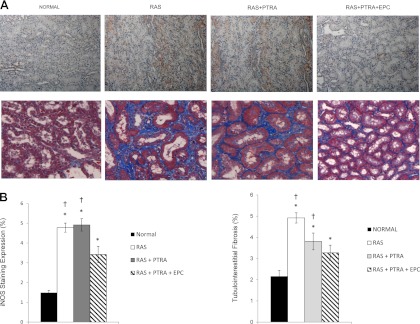
Medullary staining of inducible nitric oxide synthase iNOS (A; top) as an index of inflammation and trichrome (A; bottom) of tubulointerstitial fibrosis (×40), and the quantifications (B). Values are means ± SE. *P < 0.05 vs. sham. †P < 0.05 vs. RAS+PTRA+EPC.