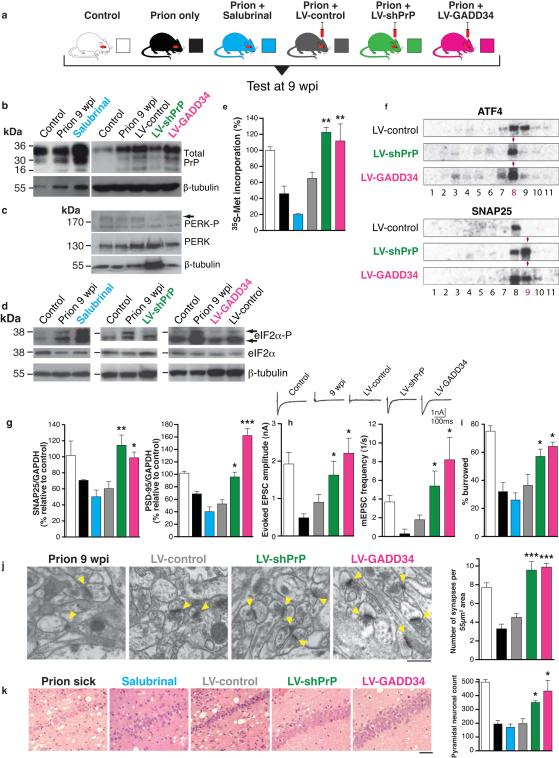
Fig. 3. Preventing eIF2α-P formation or promoting its dephosphorylation in prion-diseased mice rescues synaptic failure and neuronal loss, while increased eIF2α-P levels exacerbate neurotoxicity.
a, Mice were infected with RML prions and treated with salubrinal (blue) or stereotaxically injected with lentiviruses expressing anti-PrP shRNA (LV-shPrP; green) or GADD34 (LV-GADD34; pink) or no insert (LV-control; grey) into both hippocampi. Control groups received no virus (prion only; black) or normal brain homogenate (NBH; control; white). Mice were tested at 9wpi. b, LV-shPrP reduced total PrP and prevented UPR induction, reducing levels of PERK-P c and eIF2α-P, d. LV-GADD34 reduced eIF2α-P despite PERK-P induction, and salubrinal increased eIF2α-P. e, Both LV-GADD34 and LV-shPrP prevented reduction in global translation at 9wpi, but salubrinal reduced translation rates even further. f, LV-GADD34 and LV-shPrP reversed prion-induced eIF2α-P-mediated translational changes of specific mRNAs in polysomal fractions shown on Northern blots. g, Synaptic protein levels; h, synaptic transmission, i, burrowing behaviour, j, and synapse number were protected by GADD34 treatment and PrP knockdown. Salubrinal exacerbated protein loss. Representative EM images (arrowheads denote individual synapses) and quantification are shown (n = 2 mice, 32 slices per mouse for each analysis). k, LV-GADD34 and LV-shPrP resulted in extensive neuroprotection of hippocampal CA1 pyramidal neurons and spongiosis (left hand panels, haematoxylin and eosin stained sections) and chart, right, when the animals were dying of scrapie at nearly 14wpi. Salubrinal accelerated neurodegeneration with extensive neuronal loss seen at 9wpi, earlier than in prion sick animals at 12wpi. Scale bar: 50μm and 2μm for EM images. All data in bar charts show mean ± s.e.m. One-way ANOVA with Tukey’s post test was used for multiple comparisons; p <0.05*; p <0.005**, p <0.0001***. For all experiments n=3 mice, unless otherwise stated. All controls are at 9wpi. For quantification of Northern and western blots see Supplementary Figs. 4 and 9.

