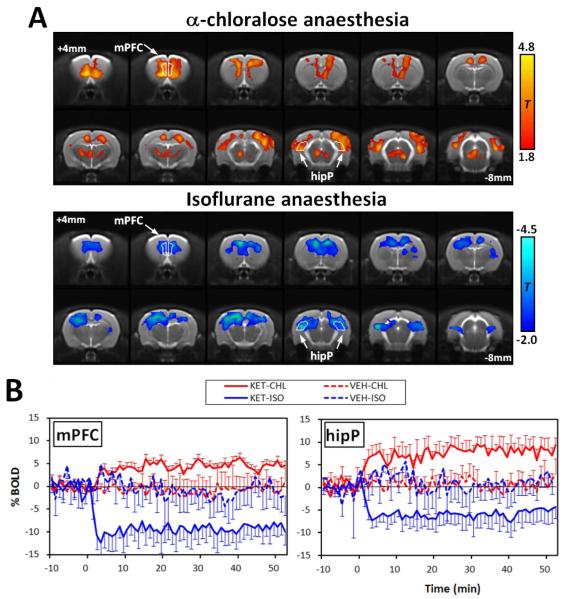
Figure 1.
(A) Statistical parametric maps indicating the two characteristic responses after acute ketmaine challenge. Maps were calculated by comparing ketamine versus vehicle in α-chloalose and isoflurane anaesthetic groups. T-statistic thresholding is reported on the right for comparison. (B) Plots showing the temporal response profiles from two representative brain regions. These are the group mean time courses from the peak responding voxels in the ROI. Time zero indicates the point of injection.
(Abbreviations; Cg, cingulated; mPFC, medial prefrontal cortex; ctxSS; somatosensory cortex; hipP, posterior hippocampus)?

