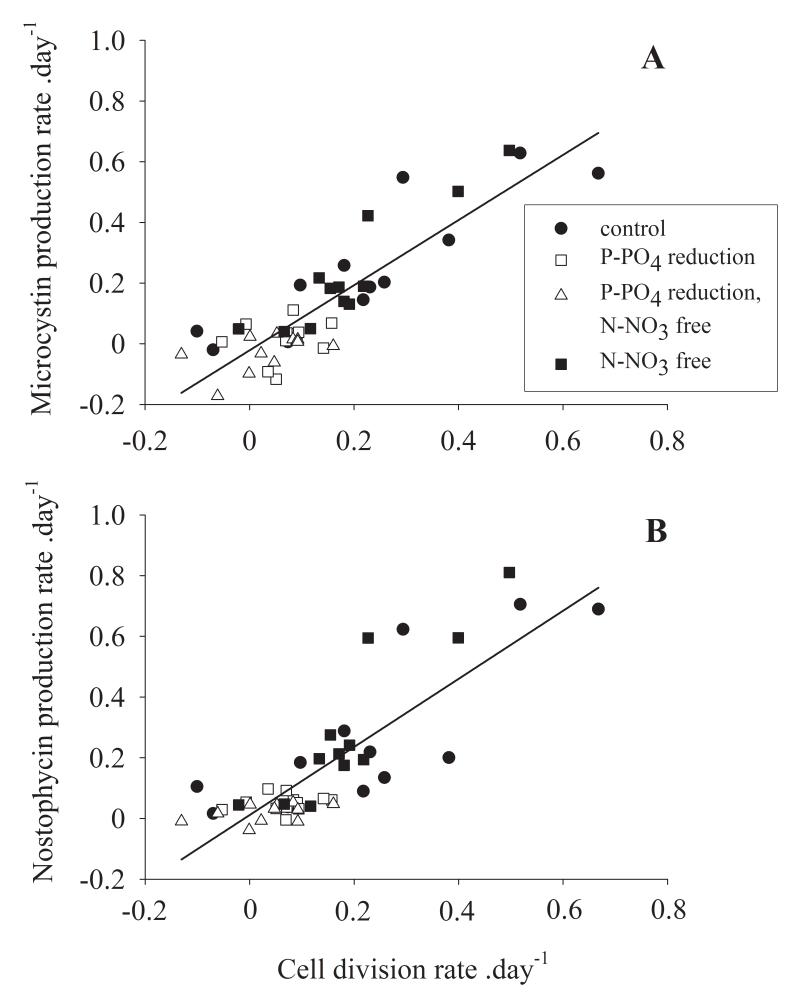
Fig. 3.
Relationship between the cellular division rate (day−1) and (A) the net MC production rate and (B) the net NP production rate (day−1). The regression curves were fitted by a linear regression calculation and least square approximation. The P-PO4 reduced treatments are indicated by open symbols, the closed symbols indicate the full medium and N-NO3 free medium. For details on regression curves see text.

