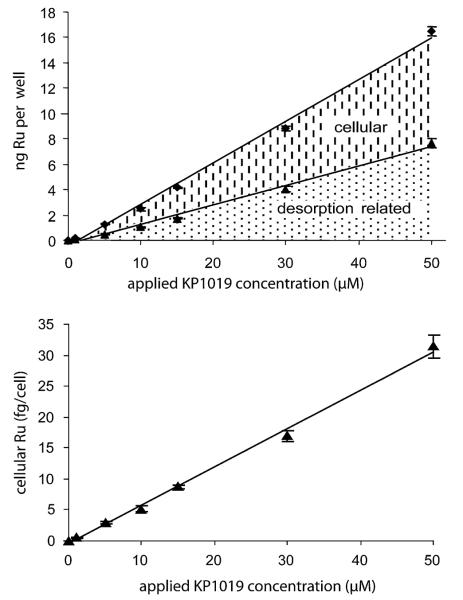
Fig. 6.
Cellular uptake of KP1019 in a concentration range up to 50 μM. top: ( ) shows total Ru (adsorbed/desorbed to/from the plates + cellular), whereas (▲) is the corresponding adsorption/desorption blank. bottom: Subtraction of the absorbed/desorbed amount from the total amount and division by the cell number led to the displayed graph, which was used for determination of LOD and LOQ.

