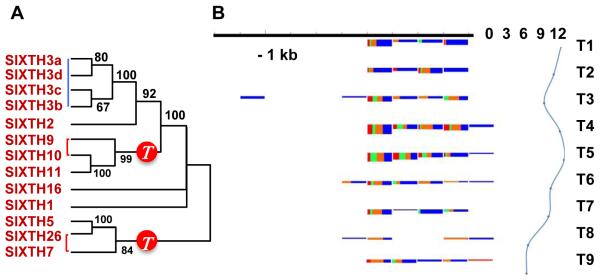
Figure 4. The tomato genome allows systems approaches to fruit biology.
A. Xyloglucan transglucosylase-hydrolases (XTHs) differentially expressed between mature green and ripe fruits (Supplementary Section 5.7). These XTH genes and many others are expressed in ripening fruits and are linked with the Solanum triplication, marked with a red circle on the phylogenetic tree. Red lines on the tree denote paralogs derived from the Solanum triplication, and blue lines are tandem duplications.
B. Developmentally regulated accumulation of sRNAs mapping to the promoter region of a fruit-regulated cell wall gene (Pectin acetylesterase, Solyc08g005800). Variation of abundance of sRNAs (left) and mRNA expression levels from the corresponding gene (right) over a tomato fruit developmental series (T1 – bud, T2 – flower, T3 – fruit 1- 3mm, T4 – fruit 5-7mm, T5 – fruit 11-13mm, T6 – fruit mature green, T7 – breaker, T8 – breaker+3days, T9 – breaker+7days). The promoter regions are grouped in 100nt windows. For each window the size class distribution of sRNAs is shown (21 – red, 22 – green, 23 – orange, 24 – blue). The height of the box corresponding to the first time point shows the cumulative sRNA abundance in log scale. The height of the following boxes is proportional to the log offset fold change (offset = 20) relative to the first time point. The expression profile of the mRNA is shown in log2 scale.

