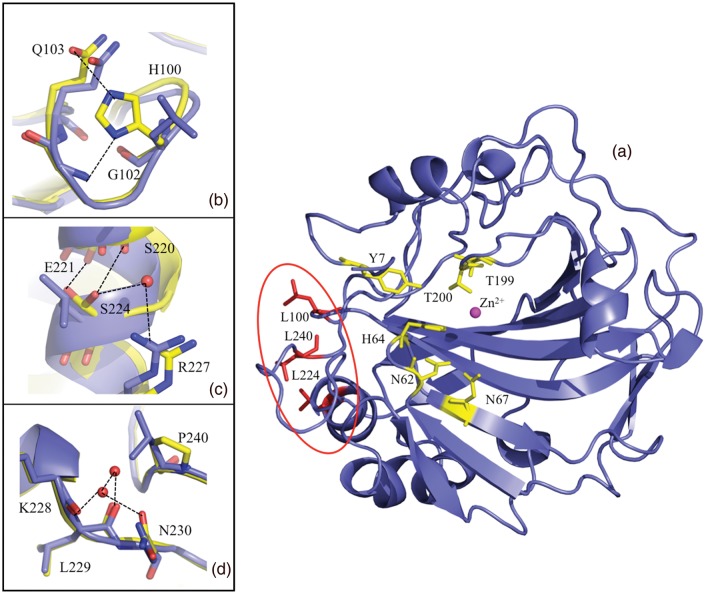
Fig. 1.
Ribbon diagram of HCA II with the active site and mutated surface residues indicated in ball-and-stick. (a) HCA II in blue with the mutated Leu residues in red, the zinc is shown as a magenta sphere with the hydrophilic residues involved with catalysis shown in yellow ball and stick. For panels (b)–(d) wild type and TS2 was superimposed to show the differences, wild type is in blue and TS2 is in yellow ball-and-stick; (b) Leu100His variant and inferred H-bonds (based on distance and angles) are shown as black dashed lines, (c) Leu224Ser, (d) Leu240Pro and waters and H-bonds. This figure was generated and rendered in PyMOL (DeLano, 2002).

