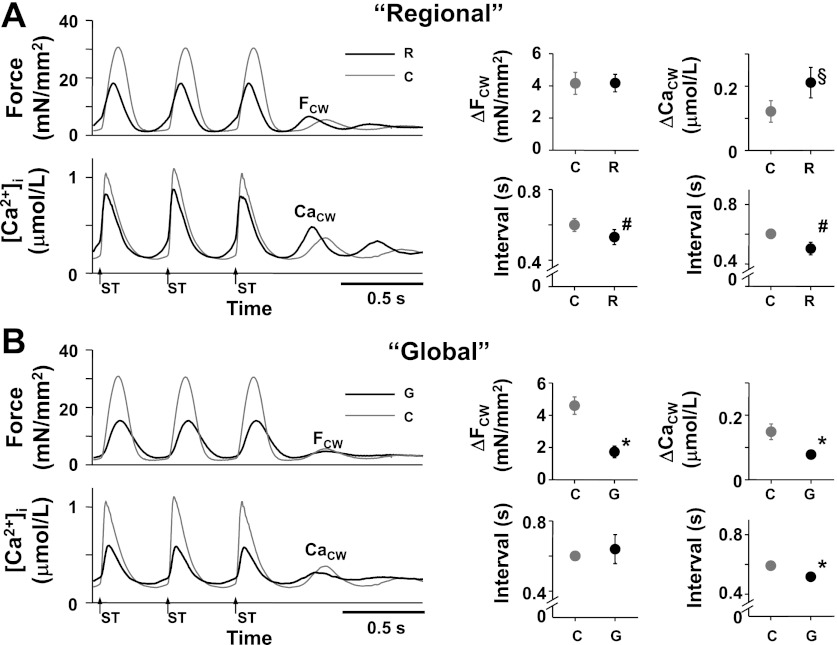
Fig. 3.
Effect of the regional (R) and global increase in [K+]o (G) on the aftercontractions (FCW) and [Ca2+]i (CaCW) during the aftercontractions in the absence of isoproterenol. ΔFCW and ΔCaCW indicate the amplitude of the FCW and that of CaCW, respectively. Arrows with ST indicate the moments of electrical stimulation. A, left: representative recordings of force (top) and average [Ca2+]i within the entire trabecula (bottom) during the last 3 electrical stimuli (400-ms stimulus interval) with (black lines, R) and without the regional increase in [K+]o (gray lines, C) ([Ca2+]o = 3 mmol/l, temperature = 23.7°C, Experiment Number 110221). Right (4 panels): summary data of the effect of the regional increase in [K+]o on the FCW and CaCW. At top (2 panels), the ΔFCW (n = 11) and ΔCaCW (n = 7). At bottom (2 panels), the intervals of the FCW and CaCW with (black symbols, R) and without the regional increase in [K+]o (gray symbols, C). #P < 0.01 vs. C (paired t-test); §P < 0.05 vs. C (Wilcoxon signed-ranks test). B, left: representative recordings of force (top) and average [Ca2+]i within the entire trabecula (bottom) during the last 3 electrical stimuli (400-ms stimulus interval) with (black lines, G) and without a global increase in [K+]o (gray lines, C) ([Ca2+]o = 3 mmol/l, temperature = 23.7°C, Experiment Number 110221). At right (4 panels): summary data of the effect of the global increase in [K+]o on the FCW and CaCW. Top right (2 panels): the ΔFCW (n = 11) and ΔCaCW (n = 6). Bottom right (2 panels): intervals of the FCW and CaCW with (black symbols, G) and without a global increase in [K+]o (gray symbols, C). *P < 0.05 vs. C (paired t-test).

