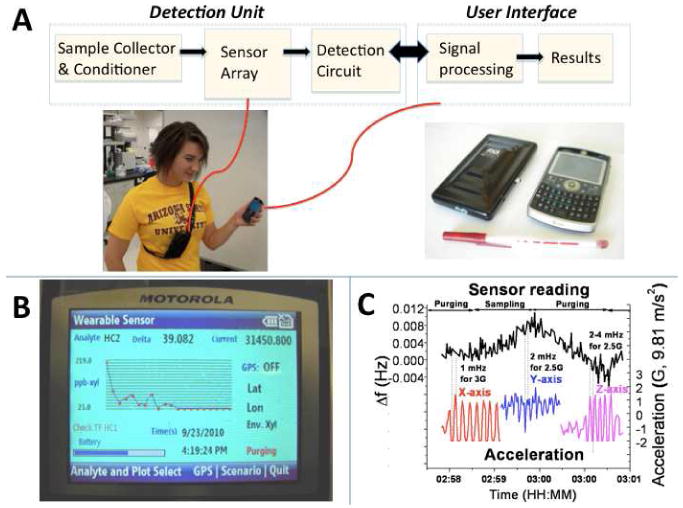
Fig.1. Wearable VOC sensor.

(A) Sensor components, and pictures. It shows a person wearing the detection unit near the breathing zone while holding the phone that acts as user interface, as well as a view of both VOC sensor components. (B) User interface on the phone, displaying the data received from the monitor. (C) Robustness test: the plot shows the sensor response (at 1-Hz data resolution) during x-, y-, and z- acceleration events detected with an accelerometer attached to the VOC sensor.
