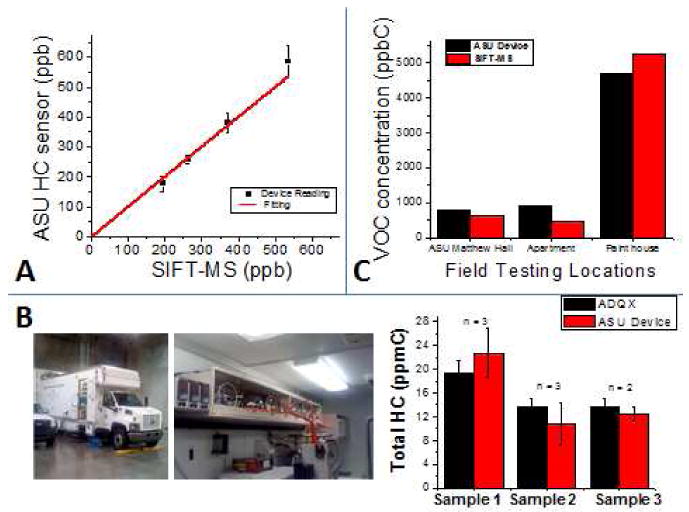
Fig. 2. Calibration and validation of the VOC sensor.

The sensor was calibrated and validated using the SIFT-MS and AQDX as standards for comparison. (A) Intra-laboratory sensor calibration and validation with SIFT-MS, using artificial samples of xylenes (n =3). The VOC sensor shows good correlation with the SIFT-MS, with a slope of 1.05, error of 3% at 95% CI. (B) VOC sensor validation with AQDX for outdoor environments. Comparative plot of total hydrocarbon readings from the ASU VOC sensor versus the results from ADQX. The number of times each sample was analyzed is shown in the plot. These tests sampled outdoor locations and show results that are in agreement. (C) VOC sensor validation with SIFT-MS for indoor environments. Comparative plot of total hydrocarbon readings from the ASU VOC sensor versus the results from SIFT-MS in samples taken from various indoor testing locations.
