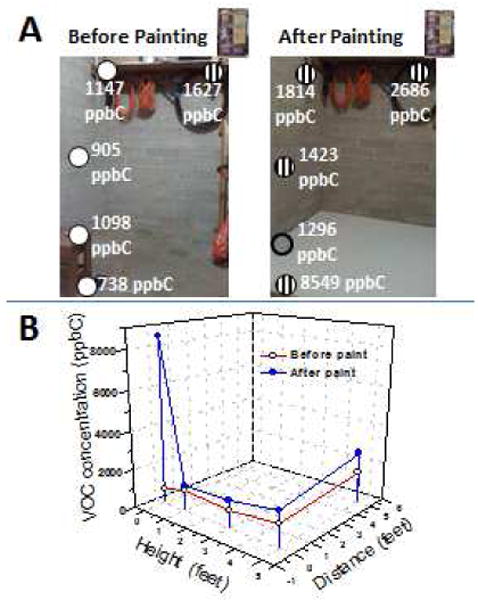
Fig. 3. VOC distribution before and after a floor painting activity.

The location of the samples taken are marked in (A). Relatively high, medium, and low concentrations are shown in striped, gray solid, and white circles, respectively. Samples were taken before painting and then one hour after painting. The exposure levels are higher near the sources of the VOCs: floor, and a paint remover can located on top of a shelf. (B) Plot showing the VOC concentrations as a function of height and distance from the painted floor and a paint remover can.
