
Fig. 4. Assessment of total hydrocarbons from traffic.
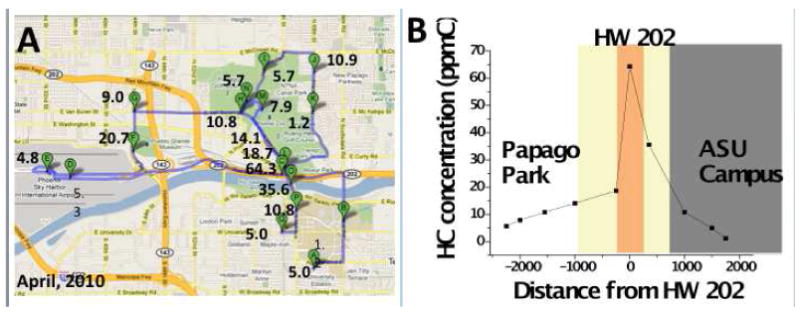
(A) Route taken around the Phoenix area. The numbers on the map show the concentrations of total hydrocarbon exposure in ppmC. (B) Hydrocarbon profile across lateral section of highway 202. The plot illustrates how the hydrocarbon concentration increases closer to the high traffic highway and decreases as the distance from the highway (in meters) increases.