
Fig. 5. Hydrocarbon assessment in the 2010 Deepwater Horizon's oil spill.
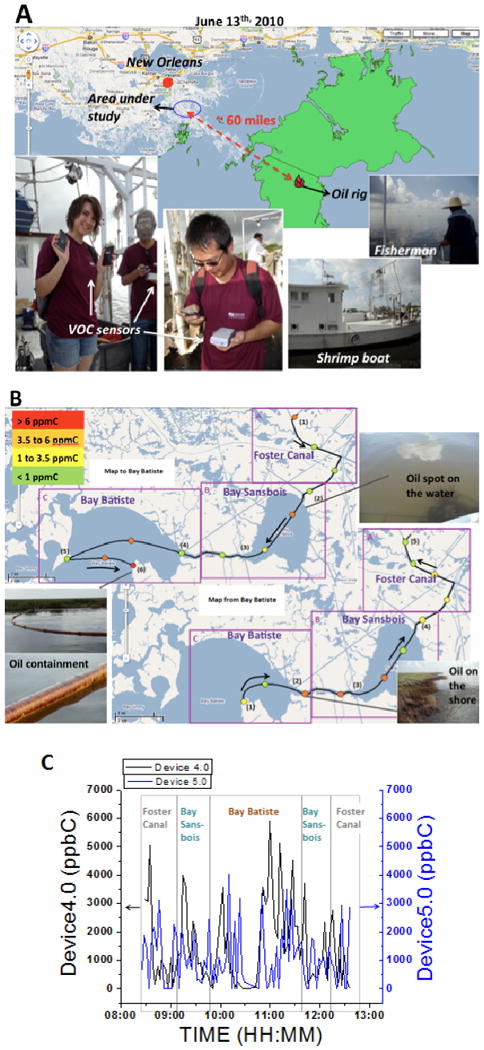
(A) Map (source: Google maps) showing the testing location approximately 60 miles from the source of the oil spill, and pictures of VOC sensors and testing conditions. (B) Hydrocarbon concentration map and route that was taken along the boat trip. One may note that both high and low concentrations are detected in Bay Batiste and that the levels do not remain the same on the way back to Foster Canal as on the way in to Bay Batiste. (C) Hydrocarbon concentration vs. time through the trip obtained from two VOC sensors (VOC sensor 4.0 and VOC sensor 5.0) that were located at different locations on the boat.