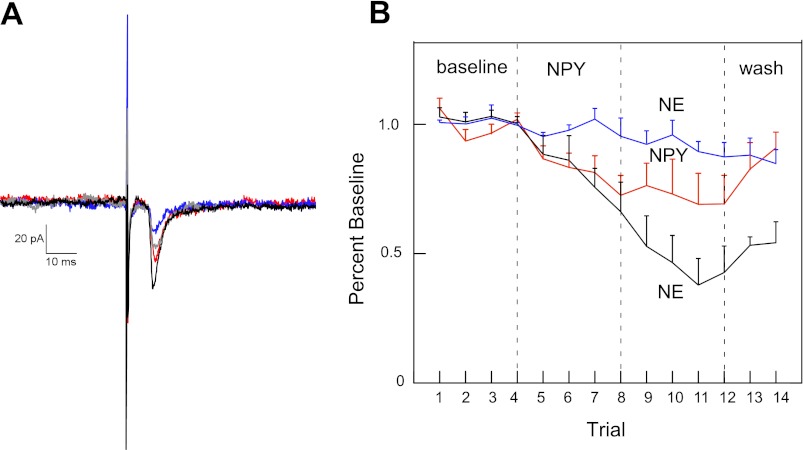
Fig. 8.
A: prehypoglossal neuron that showed suppression of the amplitude of the rostral solitary nucleus stimulation-induced excitatory postsynaptic currents (EPSC) in the presence of NPY3–36, showed a further reduction following application of norepinephrine (black: baseline; red: 0.5 μM NPY3–36; blue: 0.5 μM NPY3–36 + 0.2 μM norepinephrine; green: washout). B: this reduction was significant across a population of NPY3–36 cells showing at least a mean 10% reduction following NPY3–36 (black line: n = 6) compared with similar neurons continuing to receive only NPY3–36 (red line: n = 5). Interestingly, in four neurons not showing the 10% reduction following NPY3–36 (blue line), there was no NE effect; these neurons were excluded from the ANOVA.

