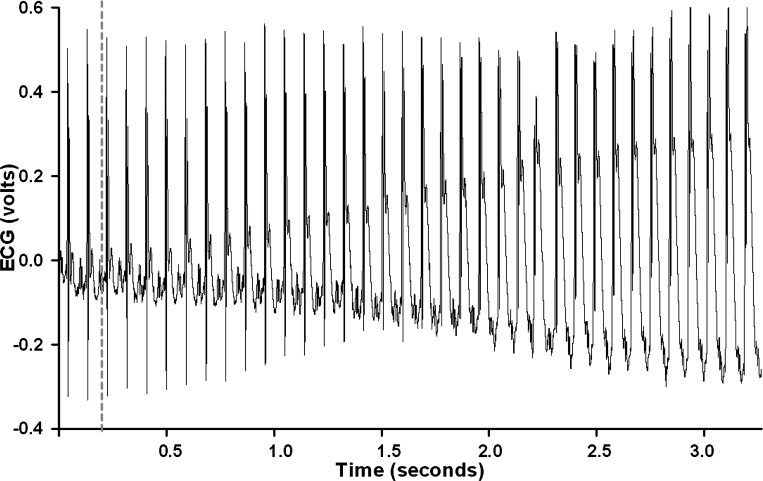
Fig. 1.
An analog recording of the electrocardiogram (ECG) at the onset of occlusion of the left anterior descending coronary artery (LAD) in an intact, conscious, and unrestrained male mouse is shown. The onset of occlusion is indicated by the dotted line. Rapid changes in the ECG (peaked T wave and S-T segment elevation) occurred within a second of pulling on the suture, documenting coronary artery occlusion.

