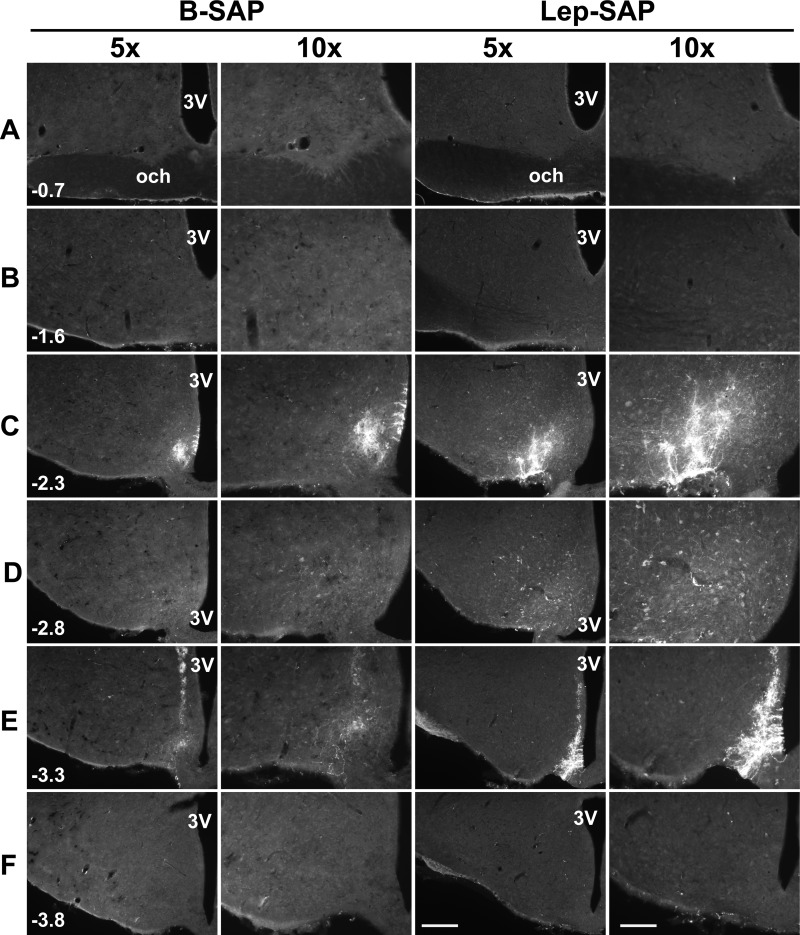
Fig. 3.
Distribution of SAP-immunoreactivity after injection of B-SAP or Lep-SAP into the Arc. Injections (50 nl each) were made at two rostrocaudal levels in the Arc (−2.3 and −3.3 mm, caudal to bregma). Rats were euthanized 4 h later. Distribution of SAP immunoreactivity was shown at two magnifications (×5 and ×10) at each of six rostrocaudal levels for a representative rat from each group between SCN (A) and the mammillary recess of the third ventricle (F) (distances in millimeters, caudal to bregma, are shown in the first image for each level). Immunofluorescent images were overexposed to show the anatomic structures. Calibration bar = 200 μm, 400 μm for ×5 and ×10, respectively. 3V, third ventricle; och, optic chiasm.

