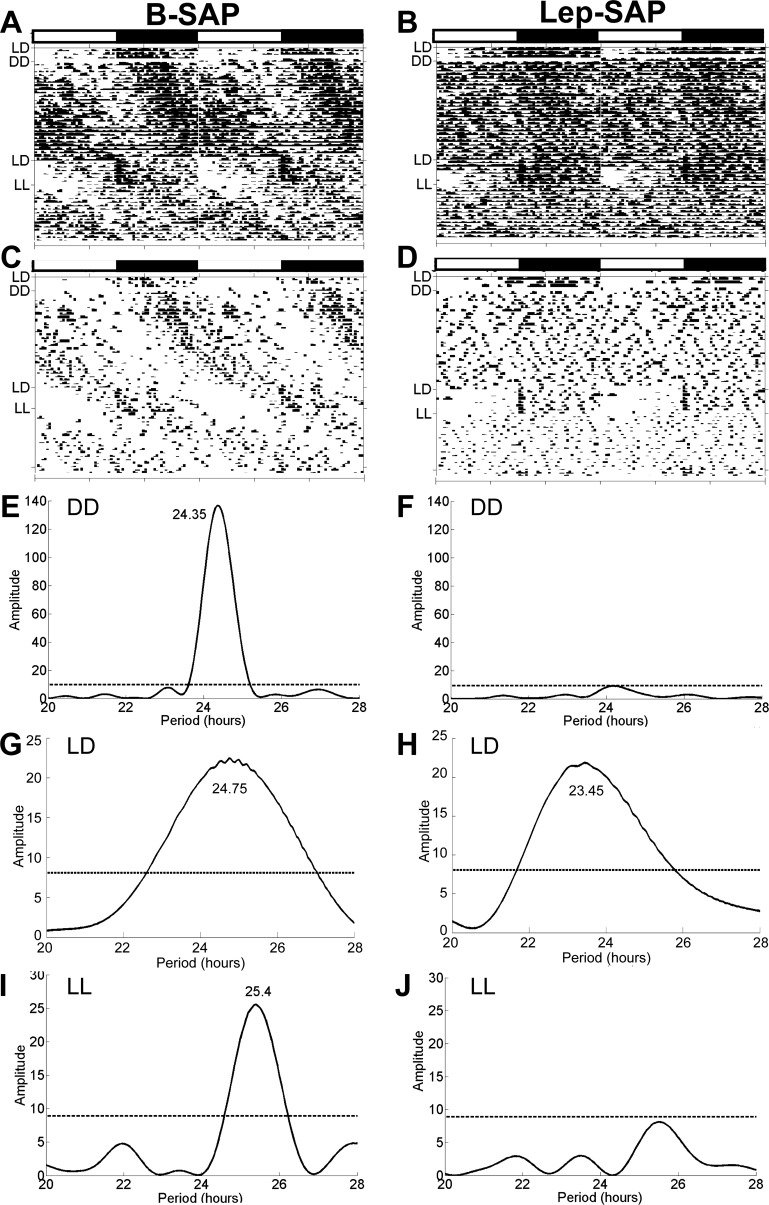
Fig. 6.
Eatograms and Lomb-Scargle periodograms over 54 days during the static phase in Arc-injected Lep-SAP rats and in B-SAP rats. Data are shown for LD (3 days), DD (28 days), second LD (7 days), and LL (16 days). The white and black bars above the eatograms mark the light and dark periods during LD, respectively. A and B: batched eatograms for B-SAP (n = 6) and Lep-SAP (n = 7) groups, respectively. C and D: eatograms for a representative individual B-SAP or Lep-SAP rat. E and F: batched periodograms for DD. G and H: batched periodograms for second LD. I and J: batched periodograms for LL, respectively. Note that the tau in G includes the transition period from DD to LD, resulting in a tau that differs somewhat from the tau shown for this group in E. The dotted line represents the amplitude of a periodogram required for significance (P < 0.05).

