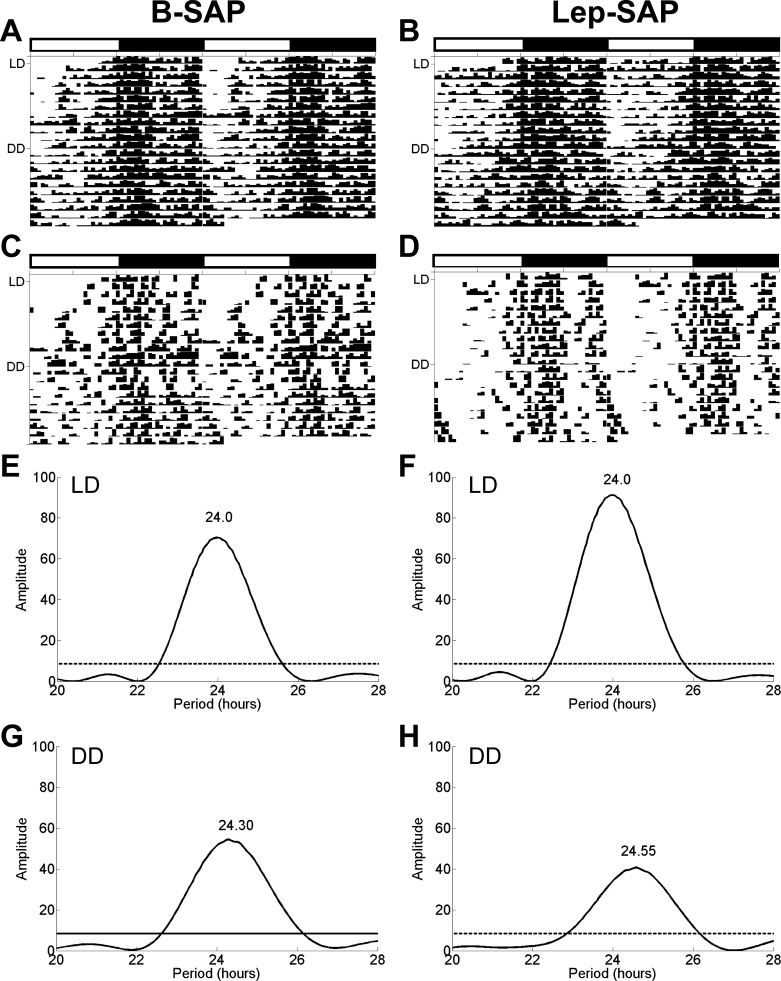
Fig. 8.
Eatograms and Lomb-Scargle periodograms over 23 days in rats injected into the VMN with B-SAP or Lep-SAP. For the first 12 days, the rats were in 12:12-h LD and thereafter in DD. The white and black bars above the plots mark the light and dark periods during LD, respectively. A and B: batched eatograms for VMN B-SAP (n = 6) and Lep-SAP (n = 7) rats, respectively. C and D: eatograms for an individual VMN B-SAP and Lep-SAP rat. E and F: batched periodograms in LD. G and H: batched periodograms in DD. The dotted line in the periodograms indicates the required amplitude for statistical significance (P < 0.05).

