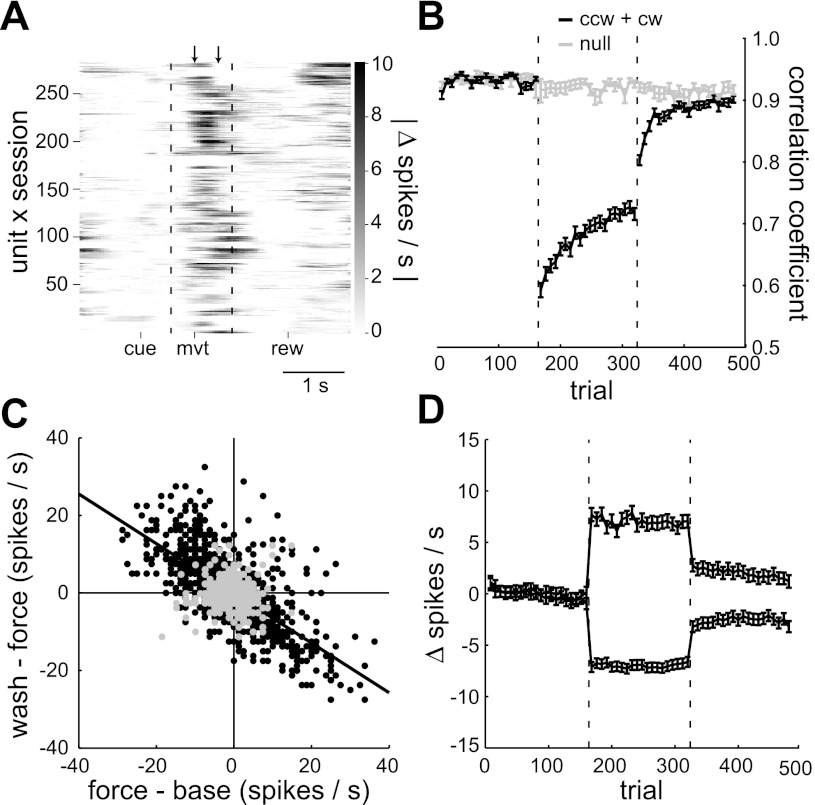
Fig. 4.
Population results: force-field vs. control sessions. A: absolute difference in perievent spike rate between the baseline and force-field epochs for each of the 281 unit × sessions. Arrows indicate the first 400 ms after movement onset in which most of the spike rate changes occurred. The vertical dotted lines divide the three perievent time windows. B: mean, within-session performance profile for all force-field sessions (black) and control sessions (gray). Performance was quantified by the velocity correlation coefficient. C: interepoch mean spike rate changes for each unit × session × direction in force-field sessions (black, N = 1,544) and control sessions (gray, N = 704). The black regression line indicates the significant anticorrelation between the interepoch changes in force-field sessions. D: within-session profile of spike rate changes in force-field sessions relative to mean baseline rate. Profiles were averaged separately depending on whether the mean rate change between the baseline and force-field epochs was positive (N = 654/1,544) or negative (N = 890/1,544). Error bars in B and D indicate SE values. The vertical dotted lines in B and D divide the baseline, force field, and washout trials.

