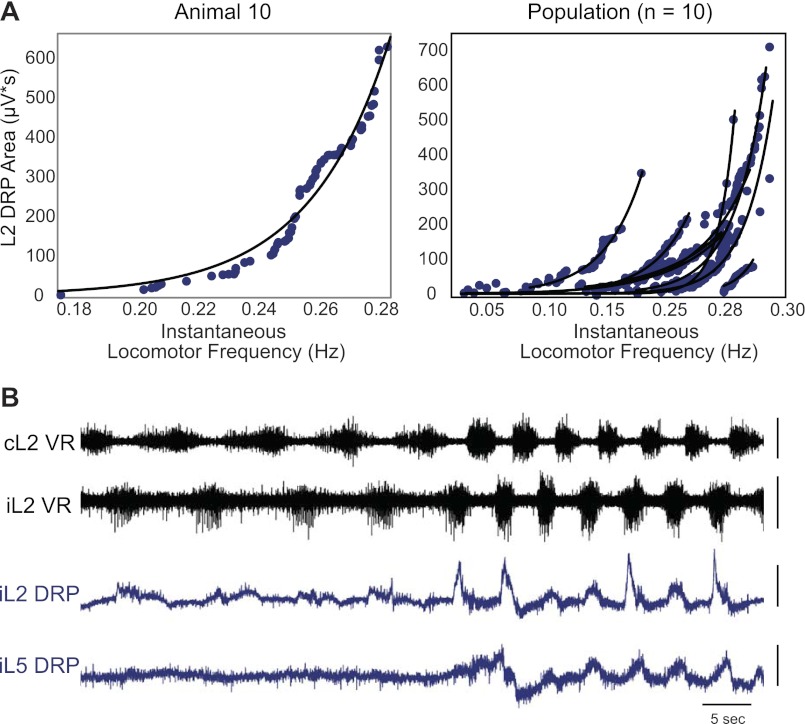
Fig. 5.
Relationship of DRP magnitude to locomotor frequency. A, left: DRP area versus instantaneous locomotor frequency fitted by an exponential curve (y = aebx, where y = DRP area, x = frequency) for a representative animal, whereas the right panel shows exponential fits for ten animals. As seen in both panels, DRP area increases with increasing locomotor frequency such that more swing-phase sensory inflow is inhibited at higher speeds. B: in another animal, the paw stuck to the plate in the middle of a locomotor bout. This natural perturbation resulted in a rapid increase in frequency and force. As a result, both the L2 and L5 DRP rapidly increased. This was an unusual and extreme case, but it highlights the increase in presynaptic inhibition with locomotor frequency and force. Scale bars: 10 s, 200 μV.

