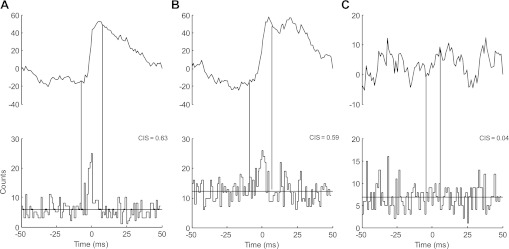
Fig. 4.
Representative data showing the cross-histograms and cumulative sum (CuSum) for motor unit pairs in a representative subject during a 10% MVC contraction. The motor unit pairs are detected from the C2 level [A; common input strength (CIS): 0.63], the C5 level (B; CIS: 0.59), and between the 2 levels (C; CIS: 0.04). Vertical lines indicate the boundaries of the synchronous peaks as determined from the CuSum.

