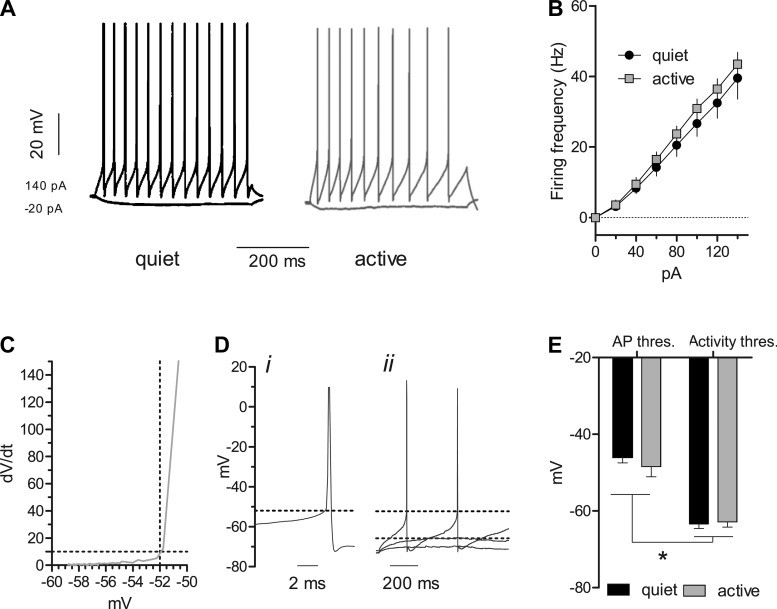
Fig. 2.
Active and quiet fusiform cells display similar excitability. A: representative examples of membrane potential response of quiet and active fusiform cells to hyperpolarizing (−20 pA) and depolarizing (140 pA) current injection. Active neurons for all panels of this figure were “silenced” by injection of hyperpolarizing current. B: average frequency-intensity (f-I) relationship of quiet and silenced fusiform cells. The f-I slopes are not significantly different between quiet and active neurons (quiet: n = 11, slope = 0.29 ± 0.02 Hz/pA; active: n = 11, slope = 0.32 ± 0.02 Hz/pA; P = 0.35). C: phase plane plot [first derivative of the membrane potential (dV/dt)] around the AP threshold. The sudden increase of dV/dt above 10 V/s (horizontal, dashed line) signals the AP threshold (vertical, dashed line). D: the same AP used to produce the plot in C in an expanded (i) and compressed (ii) time scale. i: the horizontal, dashed line represents the AP threshold measured in C. ii: application of small, depolarizing steps (20 and 40 pA) reveals the membrane potential, above which fusiform cells start producing spontaneous firing (activity threshold: lower, dashed, horizontal line). E: activity threshold is more hyperpolarized than AP threshold. Summary of the AP threshold (thres.) and activity threshold [AP threshold: quiet = −45.0 ± 1.5 mV, active = −48.4 ± 2.6 mV, P > 0.05, unpaired t-test; activity threshold: quiet = −63.4 ± 1 mV, active = −62.8 ± 1 mV, *P > 0.05, unpaired t-test; n = 7 for each group].

