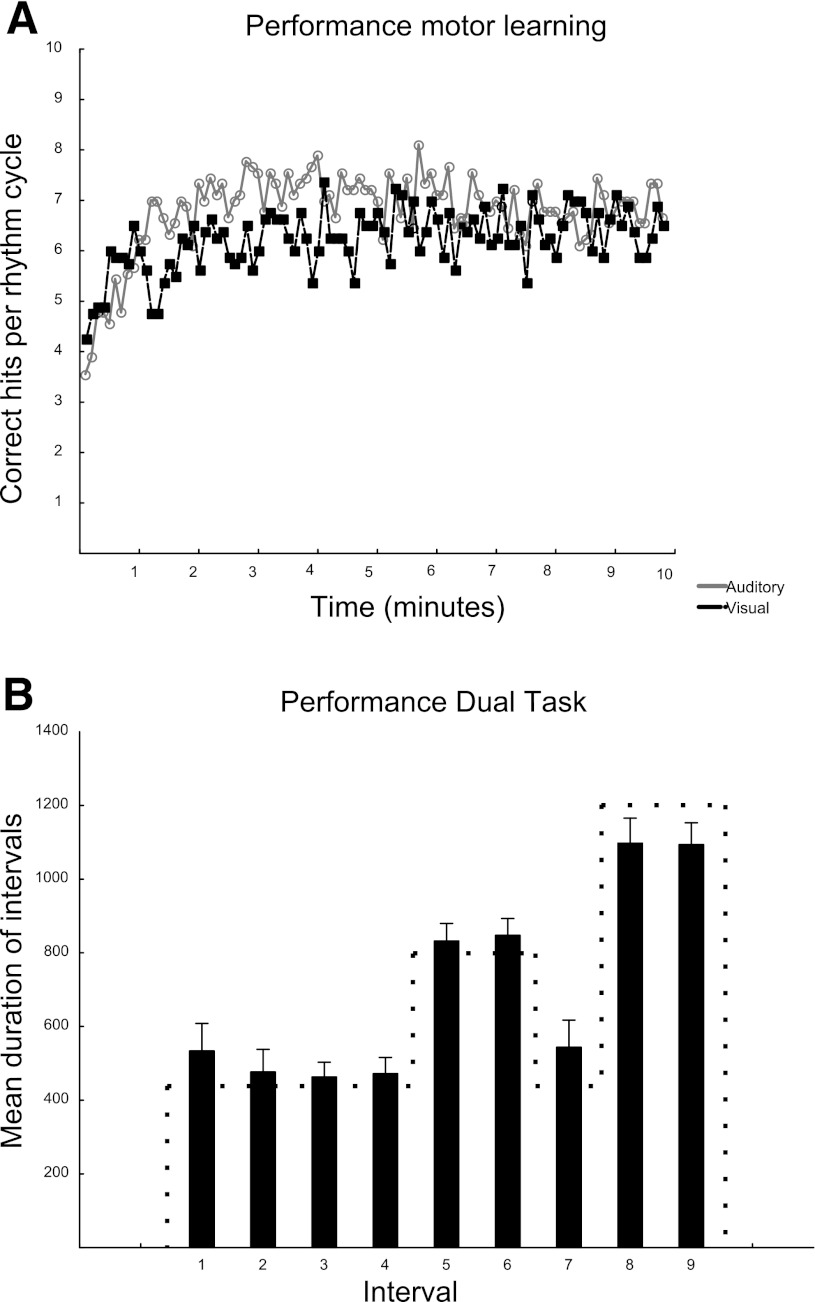
Fig. 3.
Behavioral results. A: performance during sensory training. The number of correctly pressed (CP) intervals for each rhythm cycle is displayed for the visual (black) and the auditory (gray) learners separately. B: the performance during the dual task across all participants. Each bar shows the mean duration in milliseconds (ms) of one of the intervals of the rhythmic sequence (mean + SE). The dotted line indicates target durations of each interval.

