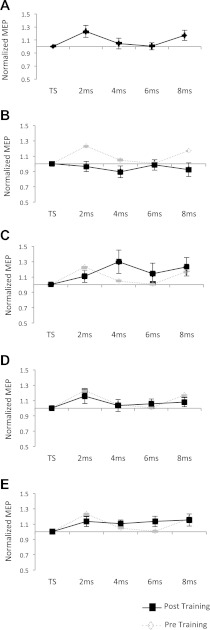
Fig. 4.
A: transcranial magnetic stimulation (TMS) curve before training. Each data point represents the mean ± SE for the test stimulus alone as well as for all four paired-pulse interstimulus intervals (ISIs; 2, 4, 6, 8 ms). MEPs are normalized to the test stimulus (TS). B–E: The normalized MEP data after sensorimotor training. B: the normalized MEPs directly after the tapping session. C: the normalized MEPs 30 min after sensorimotor training. D: the normalized MEPs 60 min after sensorimotor training. E: the normalized MEPs 180 min after sensorimotor training. All post-training data are plotted in black. The pretraining results are displayed in B–E in gray for comparison.

