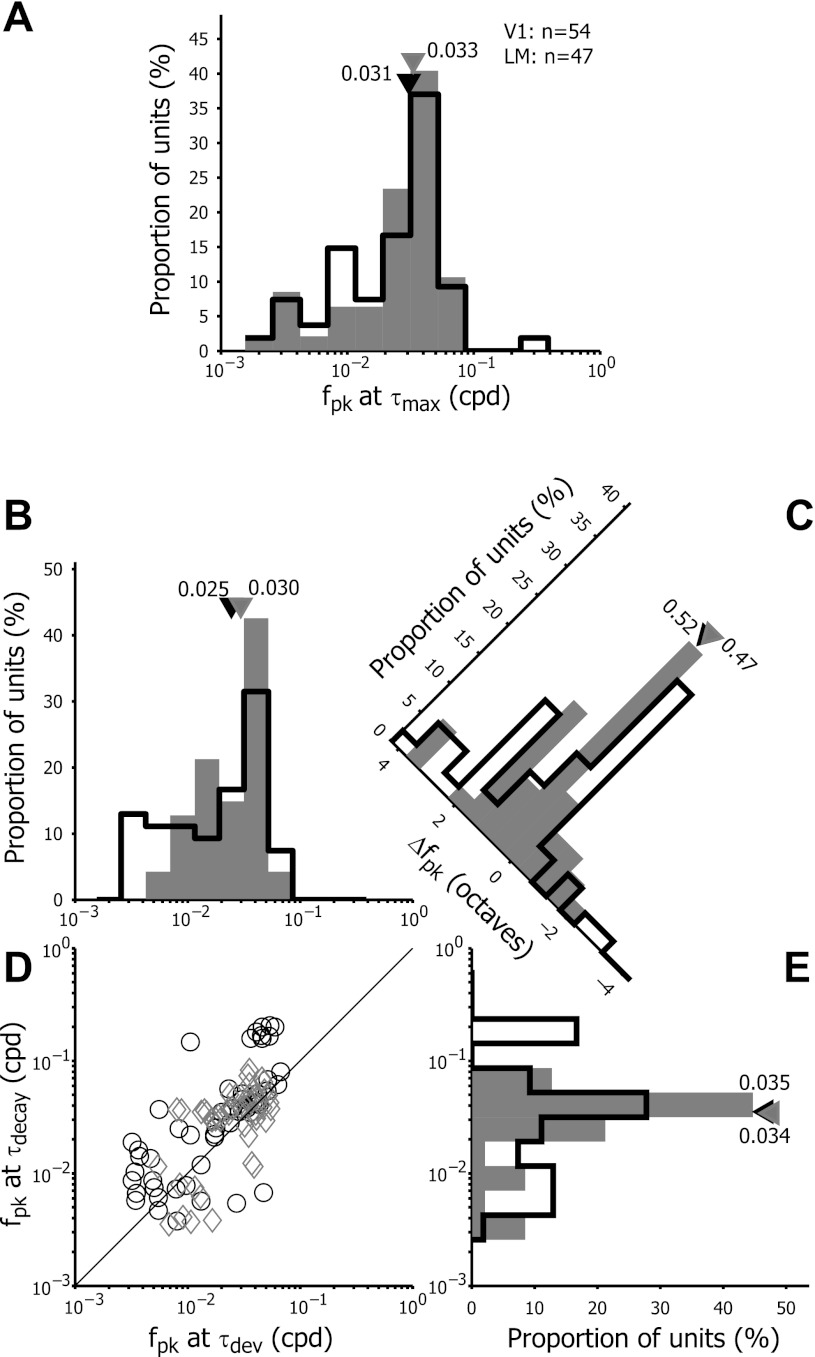
Fig. 4.
Frequency distribution of preferred spatial frequencies fpk at τmax (A). The distribution is given for both primary visual cortex (V1, open bars) and lateromedial (LM) neurons (filled bars). The black and gray triangles illustrate the median values of fpk at τmax for V1 and LM, respectively. Shift of fpk over the response duration in V1 (open bars) and LM (filled bars) (B–E). B and E: frequency distributions of fpk at τdev and τdecay. D: scatter plot of fpk measured at τdev vs. τdecay. Black circles depict V1 neurons, and gray diamonds depict LM units. The solid line indicates the unit line, where fpk at τdev is equal to fpk at τdecay. C: frequency distribution of the difference in fpk between τdecay and τdev (Δfpk). Triangles indicate median values of the population data.

