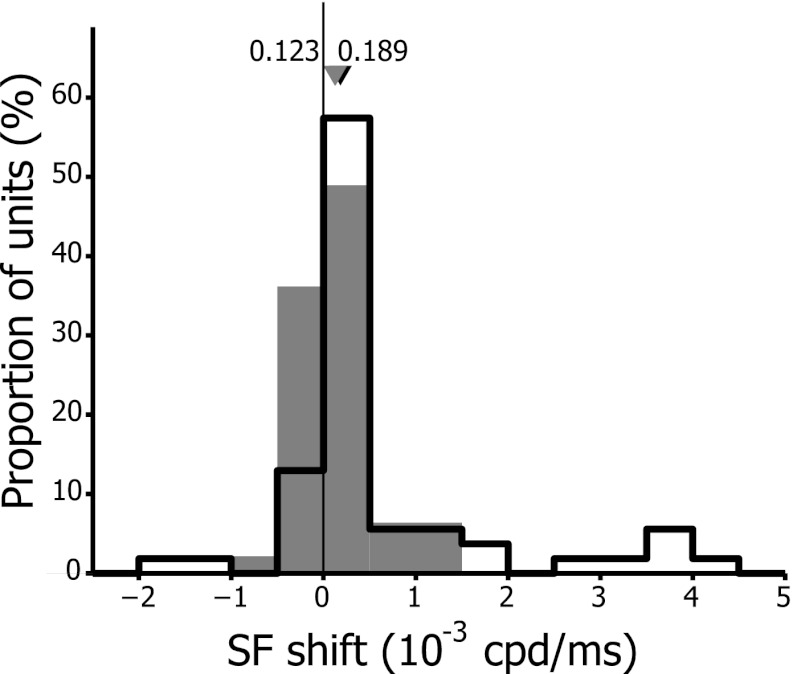
Fig. 5.
Distribution of optimal spatial frequency (SF) rate of change in V1 (open bars) and LM (filled bars). Rates of change were obtained from the slope of the line fitted to the plot of fpk vs. τ between τdev and τdecay. Positive values indicate increasing fpk over time, and negative values reflect decreasing fpk. Black and gray triangles correspond to median values of the rate of change for the population of V1 and LM cells, respectively.

