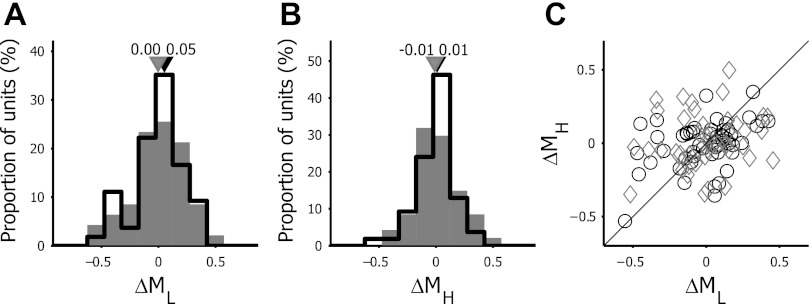
Fig. 8.
Temporal dynamics of steepness in tuning curves. A: frequency distribution of the change in steepness between τdev and τdecay for the part of the tuning curve below fpk [ML = flow/fpk, ΔML = ML(τdecay) − ML(τdev)]. B: frequency distribution of the change in steepness between τdev and τdecay for the part of the tuning curve above fpk [MH = fpk/fhigh, ΔMH = MH(τdecay) − MH(τdev)]. Open bars indicate V1 neurons, and filled bars represent LM neurons. Black and gray triangles depict the median values of V1 and LM neurons, respectively. C: scatter plot of the temporal change in steepness of the low vs. high spatial frequency segment of the tuning curves. Black circles indicate V1 neurons, and gray diamonds correspond to LM neurons. The black line illustrates the unity line where ΔML and ΔMH are equal. Positive values of ΔML and ΔMH indicate that the corresponding side of the tuning curve becomes steeper over time, whereas negative values represent a decrease in steepness.

