
Figure 5. Hypoxia-induced angiogenesis in other brain regions.
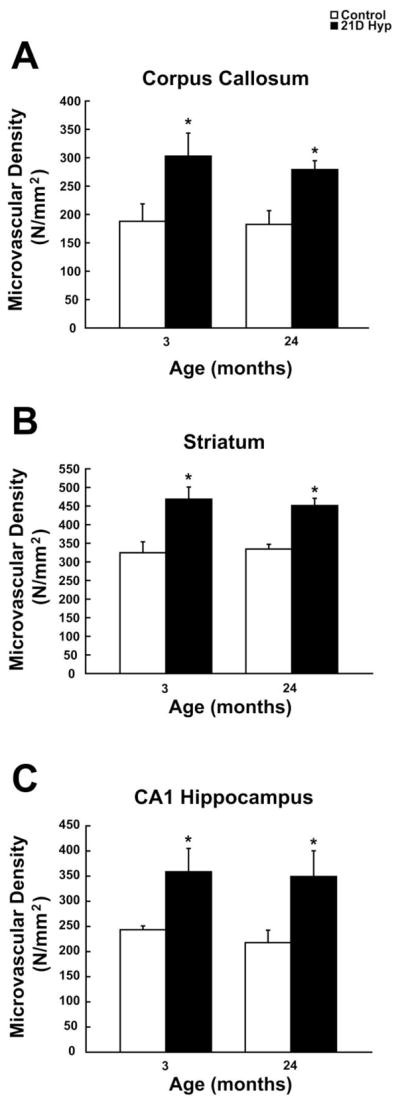
Callosal (A), striatal (B), and CA1 hippocampal (C) microvascular density (microvessels per mm2) analysis of GLUT-1 positive stained sections before and following chronic hypoxia as a function of age. Each value represents the mean +/− SD from at least three rats with the individual values from each rat being the average of at least four different sections per region examined. Each quantified section was at least 250–300 um apart from the subsequent section. *p < 0.05 compared with control value.