Fig. 4.
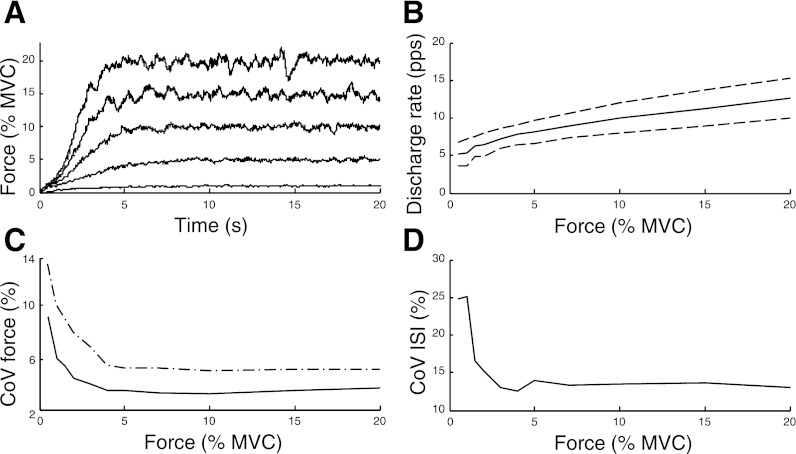
The simulated force for 20-s contractions at 5 target forces (A; 1%, 5%, 10%, 15%, and 20% MVC force), the average ± SD discharge rate for all active motor units (B), CoV for force in simulations with (dash-dotted line) and without (solid line) motor unit synchronization (C), and the average CoV for ISI for all active motor units (D) for the simulated target forces.

