Fig. 3.
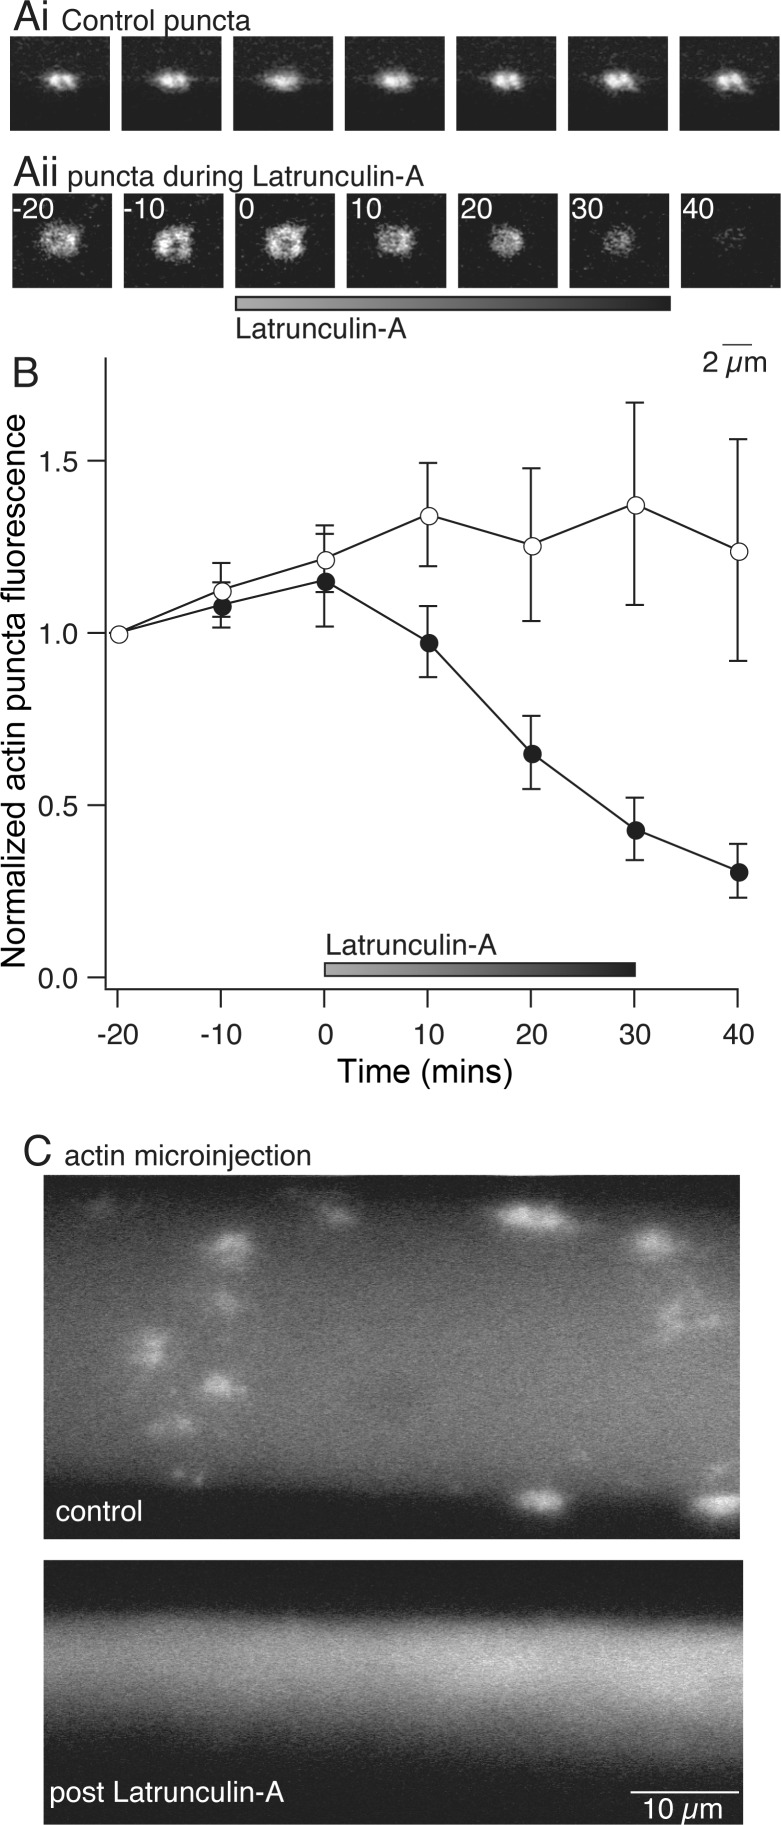
Visualization of actin dynamics and disruption with latrunculin-A. Axons were labeled with fluorescent G-actin by pressure injection (as in Fig. 2). After injection, axons were reimpaled with an electrode containing 3 M KCl to monitor membrane potential. A: examples of G-actin labeling at synaptic vesicle clusters over time. Ai: in control axon, G-actin incorporated into presynaptic clusters, which increased in fluorescence and then stabilized within 40 min. Aii: to test latrunculin-A effects, G-actin was injected into presynaptic terminals. After 20 min, latrunculin-A was perfused onto the axon. G-actin clusters dispersed. B: graph of normalized mean fluorescence of puncta from control (○; n = 7) and latrunculin-A-treated (●; n = 7) axons. C: comparison of control G-actin staining and staining after pretreatment with latrunculin-A. Top: puncta form in control axons. Bottom: axons were pretreated with latrunculin-A and subsequently microinjected with G-actin. No G-actin clustering was observed after latrunculin-A, although diffuse fluorescence was observed.

