Fig. 1.
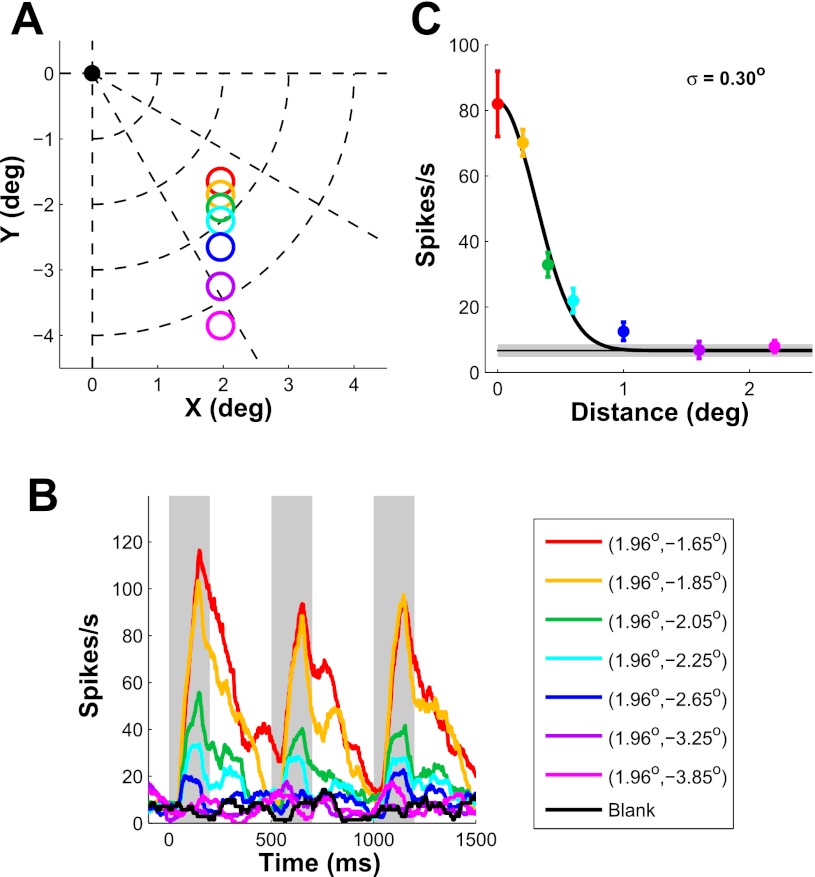
Position tuning properties of an example V1 neuron. A: stimulus position. Fixation point is at the origin. Colored circles indicate stimulus positions with circle radius equal to stimulus σ (0.167°). B: peristimulus time histogram (PSTH) of a V1 neuron as the distance between stimulus center and receptive field (RF) center is varied. Shaded areas show periods in which mean firing rate was computed. C: position tuning curve obtained from B. The solid curve shows a 1-dimensional (1-D) half-Gaussian fit. Estimated tuning width (σ) is indicated at top right. Horizontal line shows spontaneous activity ± SE (shaded area). Error bars represent ±SE.

