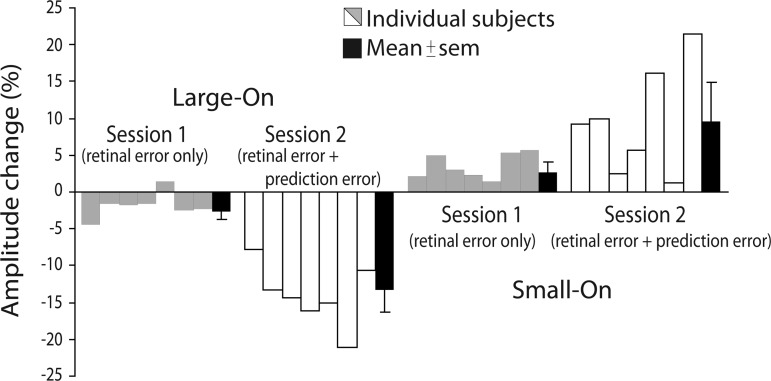
Fig. 3.
Percent amplitude change over the course of adaptation in Large-On (left) and Small-On (right) conditions. The data plotted are the difference between the posttest and baseline open-loop trials (target extinguished upon saccade onset and no reappearance). Gray and white bars are individual subjects; black bars are means ± SE. Percent amplitude change was calculated as % amplitude change = (posttest amplitude − baseline amplitude)/baseline amplitude.

