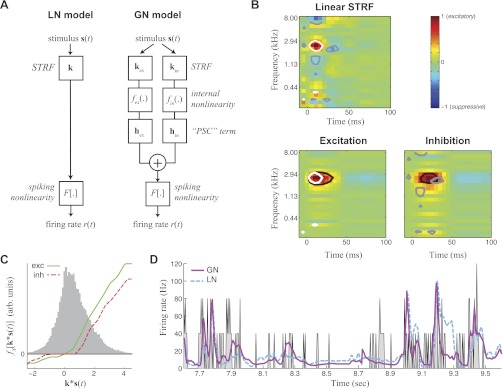
Fig. 1.
Nonlinear modeling predicts overlapping excitation (ex) and inhibition (in). A: model schematics for the linear-nonlinear (LN) model compared with the generalized nonlinear (GN) model (GNM). Rather than attempting to capture all stimulus processing with a single linear spectrotemporal receptive field (STRF; left), the GNM (right) explicitly models excitatory and inhibitory inputs as separate LN elements, which are then linearly combined and passed through a spiking nonlinearity. PSC, postsynaptic current. B: the linear STRF (top) compared with separate STRFs for excitation and inhibition of the GNM (bottom). To compare the excitatory and inhibitory influences between the 2 models, white and gray contours show the 40% of the peak magnitude of excitatory and suppressive elements in the linear STRF (top) compared with black contours showing the 40% peak magnitude of the excitatory and inhibitory STRFs of the GNM (bottom). This illustrates that excitatory regions of the linear STRF (white) are smaller than the excitation predicted by the GNM (black, bottom left), and the linear STRF has small flanking suppressive regions (gray) compared with the broader inhibition in the GNM (black, bottom right) that largely overlaps with the GNM excitation. C: nonlinearities measured in the GNM for the excitatory (exc; green) and inhibitory (inh; red) module. The gray histogram shows the distribution of the filtered stimulus values for the training data, over which the lateral nonlinearities fx(.) are applied. arb., Arbitrary. D: cross-validated peristimulus time histogram (PSTH) for the GNM (magenta) and the LN model (cyan). The measured firing rate is shown in gray.

