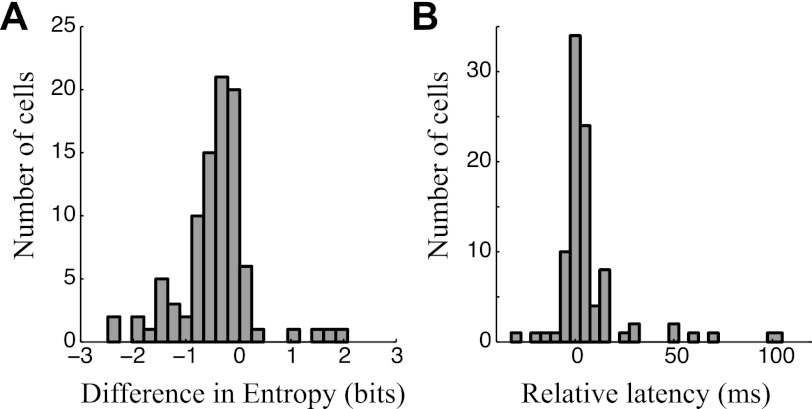
Fig. 3.
Comparisons between excitatory and inhibitory STRFs estimated by the GNM. A: histogram showing the difference between the widths of excitatory and inhibitory frequency kernels for all neurons in this study (n = 94), measured using entropy as a nonparametric measure of broadness of tuning. Nearly all values are negative, demonstrating that the inhibitory frequency kernel of the model is nearly always more broadly tuned than that of excitation. B: histogram showing the measured delay between the peak of the effective excitatory and inhibitory time kernels for the same neurons (n = 94), demonstrating that inhibition is usually delayed relative to excitation.

