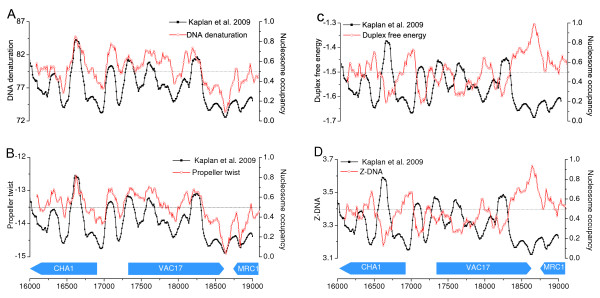
Figure 1.
Calculated structural profiles (red line) and in vitro experimental nucleosome occupancy (black line) in a 3 kb region around CHA1 promoter of S. cerevisiae (Chr. 3). Shown are two positively correlated features (A) DNA denaturation and (B) Propeller twist, and two negatively correlated features (C) Duplex free energy and (D) Z-DNA.

