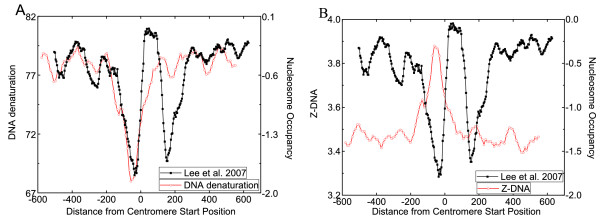
Figure 2.
Computed average structural features (red line) and average in vivo experimental nucleosome occupancy (black line) of all centromere regions in S. cerevisiae genome. Shown are the results on one positively correlated feature (A: DNA denaturation) and one negatively correlated feature (B: Z-DNA).

