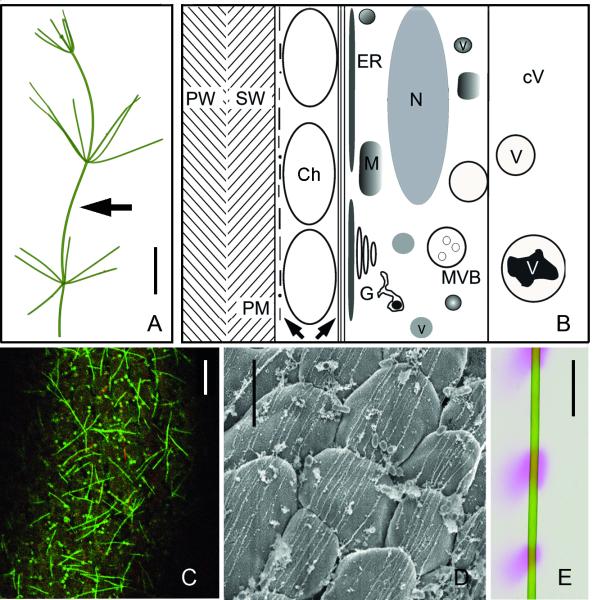
Fig. 1.
Characean internodal cell organization and pH banding. (A) A thallus of Nitella translucens. Arrow indicates an internodal cell from the main axis. (B) Schematic representation of the cytoarchitecture of an internodal cell (longitudinal section), drawn approximately to scale. Left arrow indicates cortical actin filaments and microtubules, right arrow points to the subcortical actin filament bundles. Ch = chloroplast, cV = central vacuole, G = Golgi body, ER = endoplasmic reticulum, M = mitochondrion, MVB = multivesicular body, N = nucleus, PM = plasma membrane, PW = primary wall, SW = secondary wall, v = vesicle, V = subvacuole. (C) Cortical microtubules (green) and actin filaments (red) in an internodal cell of N. translucens stained by perfusion with fluorescent taxol and fluorescent phalloidin. (D) High resolution SEM image of subcortical actin bundles located at the inner surface of chloroplast files (N. flexilis; Triton-extracted). (E) pH banding pattern of an internodal cell of N. translucens visualized by phenol red. Pink regions indicate regions of net H+ influx, which generates an extracellular alkaline pH. Bars are 1 cm (A, E), 10 μm (C) and 5 μm (D)

