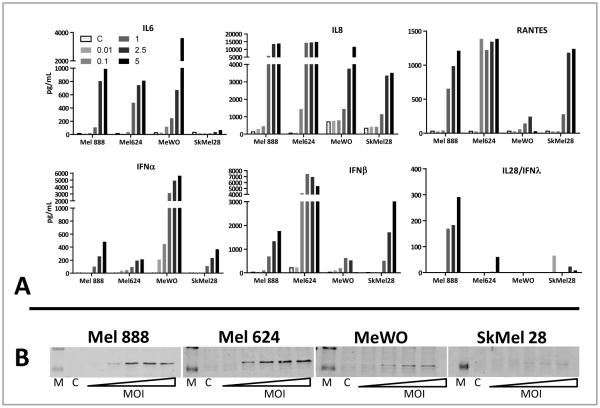
Figure 2.
The inflammatory response associated with MV infection. A; Cytokine/chemokine release. Cell-free supernatants were collected 48 hours after infection with MV and cytokine levels determined by ELISA. Data shown are representative of three independent experiments. B; HMGB1 release. Melanoma cells were treated with MV at MOI from 0.01 to 5. 48hours after infection cell-free supernatant was collected then analysed by western blot for HMGB1. Lanes with protein markers (M) and untreated controls (C) are indicated. Data shown are representative of two separate experiments.

