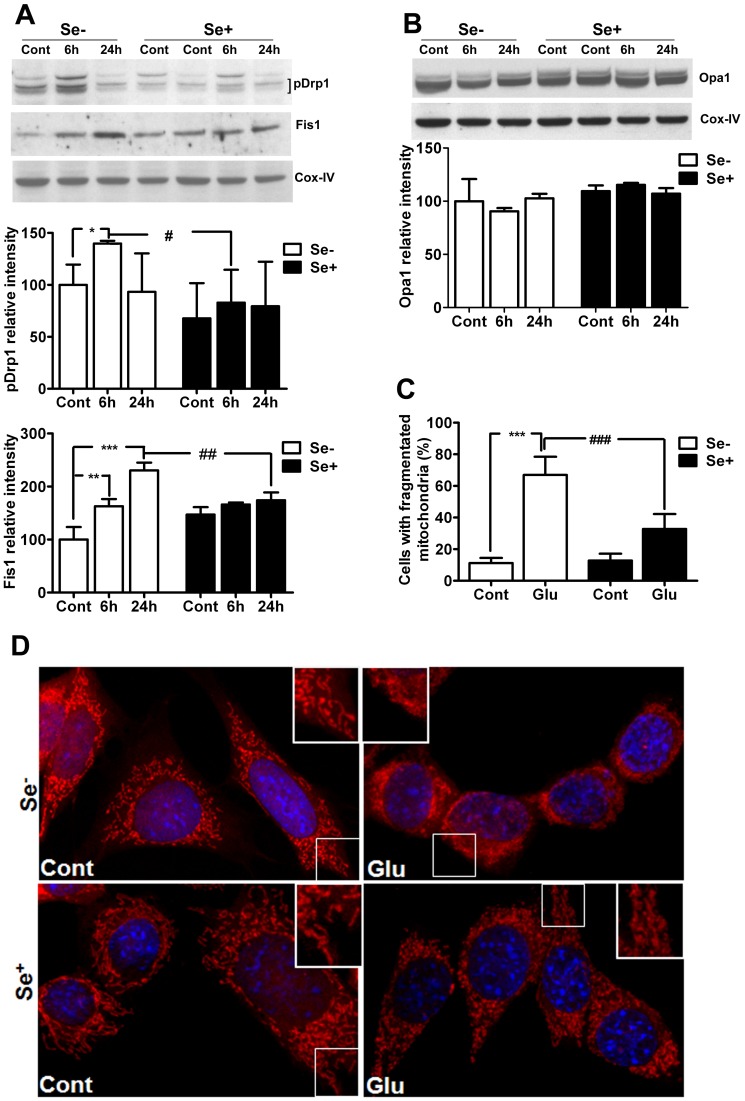
Figure 4. Influences of glutamate and selenium on mitochondrial fission and fusion protein markers.
(A) Representative Western blots and analysis of mitochondrial fission protein pDrp1 and Fis1. Glutamate increased mitochondrial fission protein markers pDrp1 after 6 h and Fis1 after 6 and 24 h of exposure. Selenium treatment inhibited the corresponding elevation of pDrp1 and Fis1 in these cells. (B) Representative Western blot and analysis of mitochondrial fusion protein Opa1. Glutamate did not affect Opa1, nor did the selenium. (C) Quantitative analysis of cells with fragmentized mitochondria shows significant increase in number of cells with fragmented mitochondria after glutamate exposure. Simultaneous application of selenium preserved mitochondrial morphology and significantly reduced number of cells with fragmented mitochondria. Minimum of 100 cells per condition were analyzed for mitochondrial morphology. (D) Micrograph shows mitochondrial morphology. Mitochondria appear long and thread like in control cells. Glutamate severely affected mitochondrial morphology, leading to mitochondrial fragmentation at 24 h of glutamate exposure. Simultaneous application of selenium prevented glutamate induced mitochondrial fragmentation. Data were collected from 5 experiments. Values are means±SD. Two-way ANOVA test followed by post hoc Bonferroni’s test was used for data analysis. *p<0.05, **P<0.01, ***p<0.001 vs. control and #p<0.05, ##p<0.01 vs. non-selenium treated, glutamate exposed cells. Cont, control, 6 h, 6 hours after glutamate exposure, 24 h, 24 hours after glutamate exposure, Se-, non-selenium treatment, and Se+, with selenium treatment. Red color indicated mitochondria whereas and blue represents DAPI nuclear staining.

