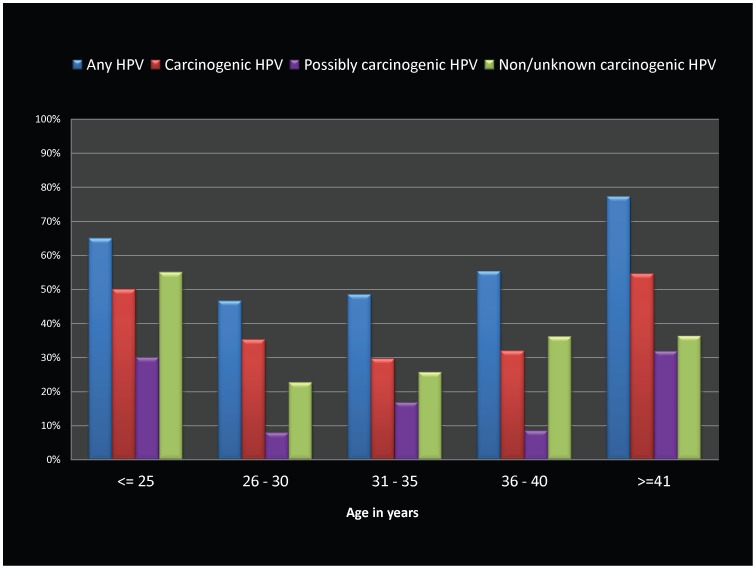
Figure 1. Bar graphs showing HPV genotype prevalence by age categories among HIV-infected women in Pune, India.
HPV prevalence levels (as percentages) are displayed on the Y-axis, with various carcinogenicity groupings (any HPV type, carcinogenic HPV type, possibly carcinogenic HPV types, and non/unknown carcinogenic types) shown as individual bar graphs grouped by age categories (≤25, 26–30, 31–35, 36–40, & ≥41 years) on X-axis.

