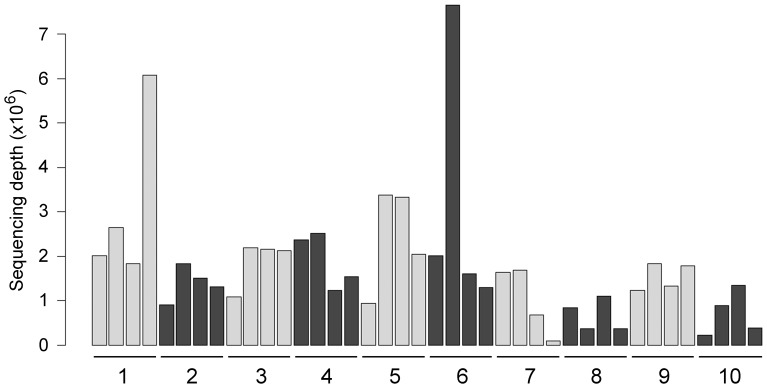
Figure 2. Histogram showing the number of sequences aligned for each of the 40 experimental samples (sequencing depth).
Numbers represent individual donors and the 4 bars from each donor correspond to untreated control, and pterygium cells treated for 24 h with 50, 200, and 500 µg/ml doxycycline (left to right). There is a large variation in sequencing depth ranging from 82,040 reads for the less represented (cells from patient number 7, treated with 500 µg/ml doxycycline) to 7,653,010 reads for the best represented (cells from patient number 6, treated with 50 µg/ml doxycycline).

