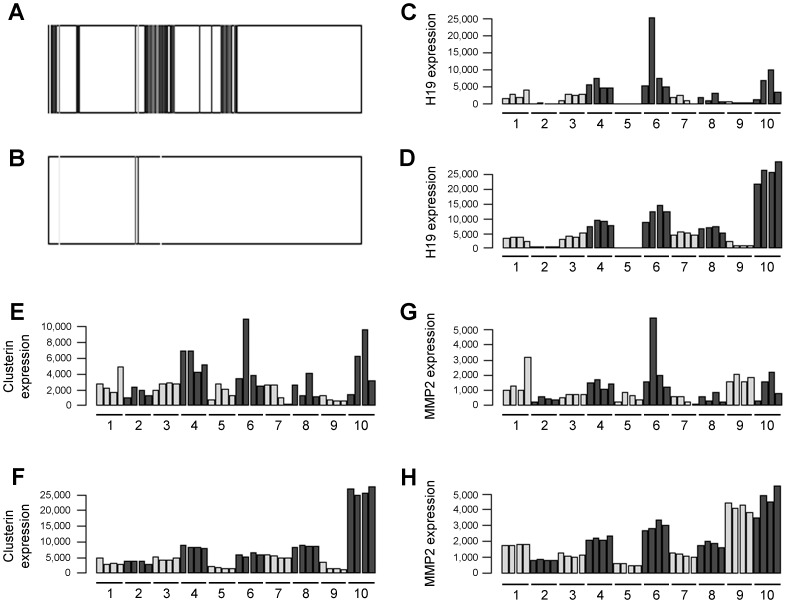
Figure 3. Experimental demonstration that a correct normalization protocol was applied to ultrasequencing data.
Representation of the expression levels in the Y chromosome in a male (A) and a female (B) patient. Each dark line represents expression of a particular exon along the length of the chromosome. The few lines observed in females correspond to repetitive regions of the genome. Expression levels for 3 representative genes: H19 (C,D), clusterin (E,F), and matrix metalloproteinase 2 (G,H) as they appear before (C,E,G) and after (D,F,H) application of our normalization protocol. Labeling of the 40 samples is the same as in Fig.1. Normalization success can be appreciated since individual variations are larger than treatment-induced changes in these genes.

