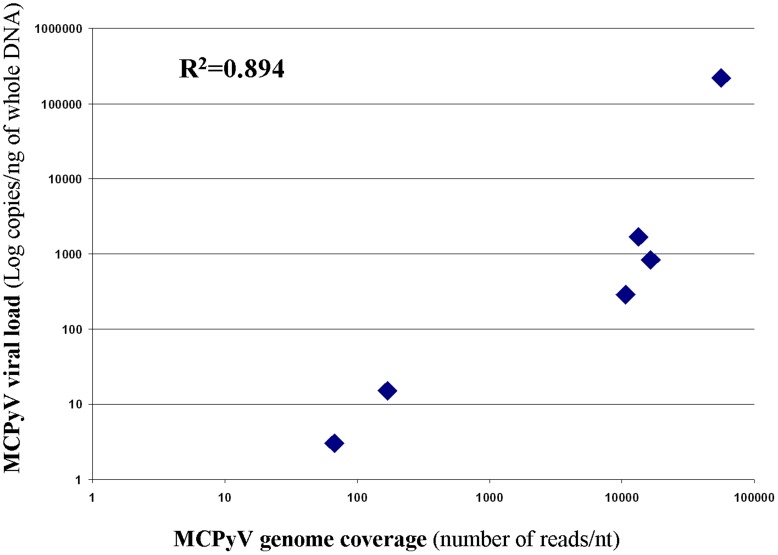
Figure 2. MCPyV genome sequence coverage versus MCPyV viral load in the six samples.
Genome coverage is expressed as number of reads per nucleotide and viral load is in genome copies per ng of whole DNA. Coefficient of correlation is: R2 = 0.894; and best fit regression equation is: [MCPyV viral load] = 4.1 [MCPyV coverage]- 28,850.

