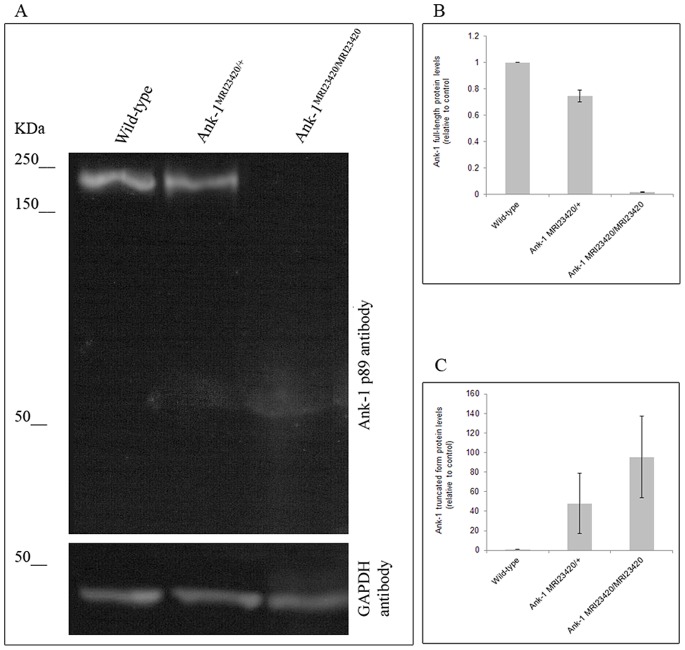
Figure 2. Protein levels of ankyrin-1 analysis.
(A) Immunoblot of erythrocytic ankyrin-1 in wt, Ank-1MRI23420/+, and Ank-1MRI23420/2340 mice with the N-terminal antibody ANK-1 p89. Quantification of the intensity of bands by densitometry for full-size ankyrin-1 (210 kDa) (B) and the truncated species (C) (calculated size 49 kDa). Error bars indicate SEM.

