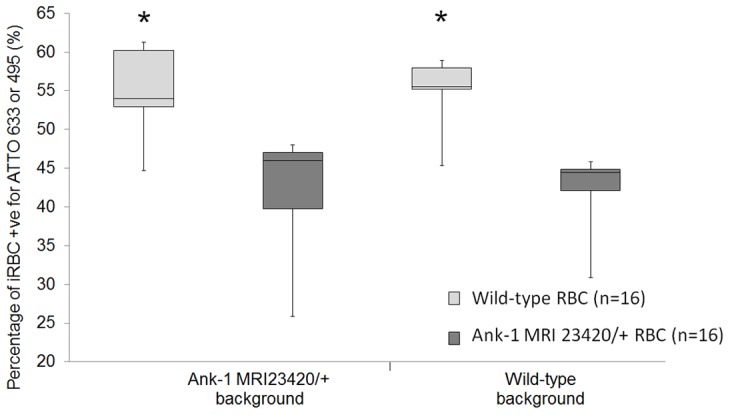
Figure 6. Infection rate of P. chabaudi in Ank-1MRI23420/+ compared to wt RBCs is impaired.

Uninfected RBCs from wt and Ank-1MRI23420/+ mice were labelled individually with different fluorescent dyes mixed at a 1∶1 ratio and injected into infected animals of both groups. 10 hours later tail blood was taken and analysed on flow cytometry gating for infected RBCs +ve for either dye (ATTO 633 & 495). Results were calculated as the mean of normal and reversible labelled RBCs from each group for each background separately. Error bars are presented as SEM and (*) indicate statistical differences with a p-value <0.0001.
