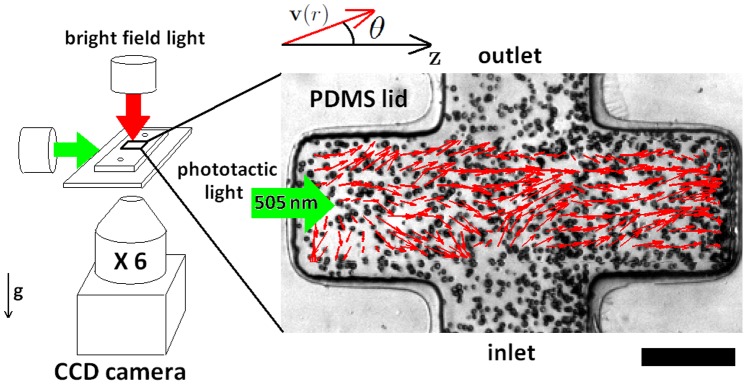
Figure 1. Experimental system.
Photo-movement assay conducted using bright field microscopy (left). A lateral green light source is used to obtain a photophobic response from an algae population swimming in the PDMS microfluidic channel. (right) PIV velocity field (red arrows) extracted from two consecutive frames, superimposed on the correspondening movie snapshot showing the spatial distribution of the algae (scale bar = 200  ). The polar angle
  represents the orientation of the velocity field vectors
  with respect to the phototaxis gradient direction

