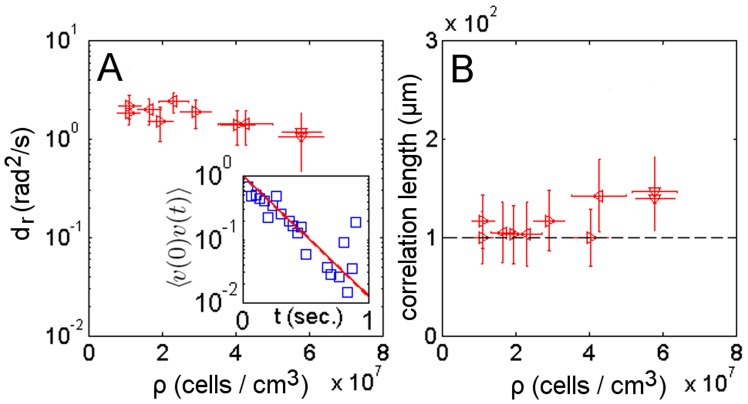
Figure 2. Temporal and spatial decorrelations.
The orientational coefficient  (A) and correlation length (B) as a function of cell suspension density for samples run in the dark. Samples from the same culture share the same mark. (inset) Time autocorrelation function of the velocity direction used to extract
  value.

