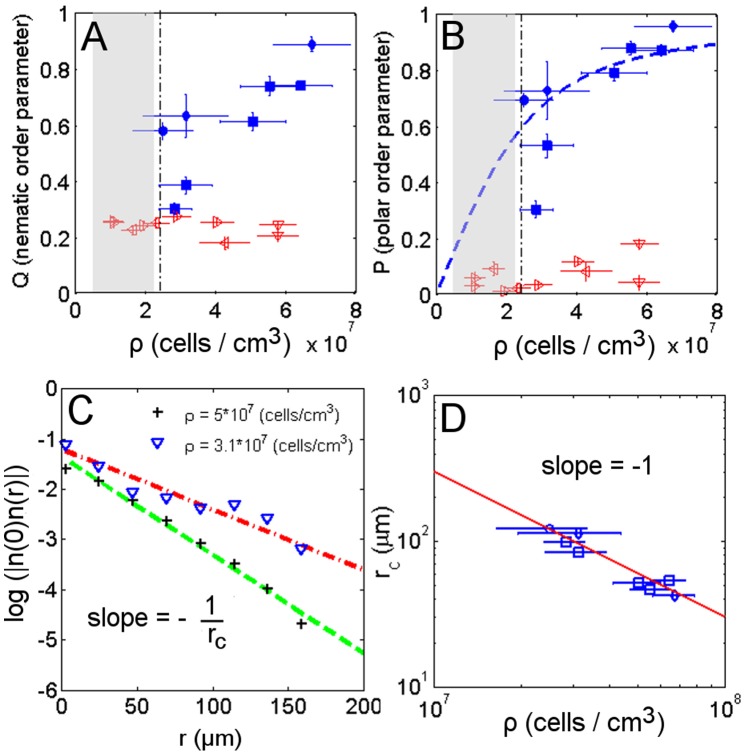
Figure 4. Order parameters and fluctuation dependence on density.
Nematic order parameter (A) and polar order parameter (B) as a function of cell density in dark (hollow marks) and phototaxis conditions (filled marks). Linear dependence of the guiding field strength on the suspension density  fit with the theoretical estimation of the average cosine (dashed line) with
  For phototactic experiments near the density threshold (dashed-dot line), both orientational order parameters are reduced. (C) Spatial correlation of the fluctuation coordinate
  for two different density samples. The higher density condition features a higher slope. (D) The inverse of the slope of the spatial correlation of the fluctuation, corresponding to the correlation radius of fluctuation
  is plotted against each sample suspension density. The slope of the logarithmic plot shows the exponent order of the relationship between the correlation radius of fluctuation
  and density
  to be
to be 

