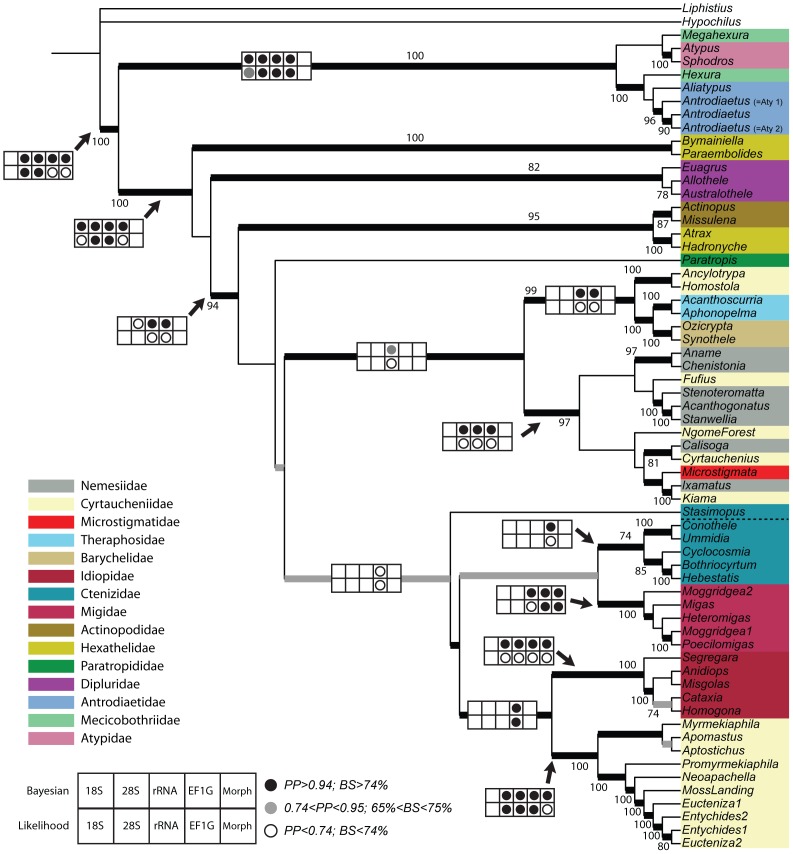
Figure 1. Summary of phylogenetic hypotheses based on molecular data partitions (28 S, 18 S, EF-1γ) using Bayesian inference.
Dot plots indicate recovery and relative support for each node in separate analyses of the individual data partitions. For the combined gene analysis, thickened black and gray branches indicate posterior probability values that correspond to dot plot values in figure legend inset; values at nodes indicate bootstrap percentage values from the combined maximum likelihood RAxML analysis.

